Basic Layout
When the Dimer Reaction Equilibrium application is started, it should look something like this:
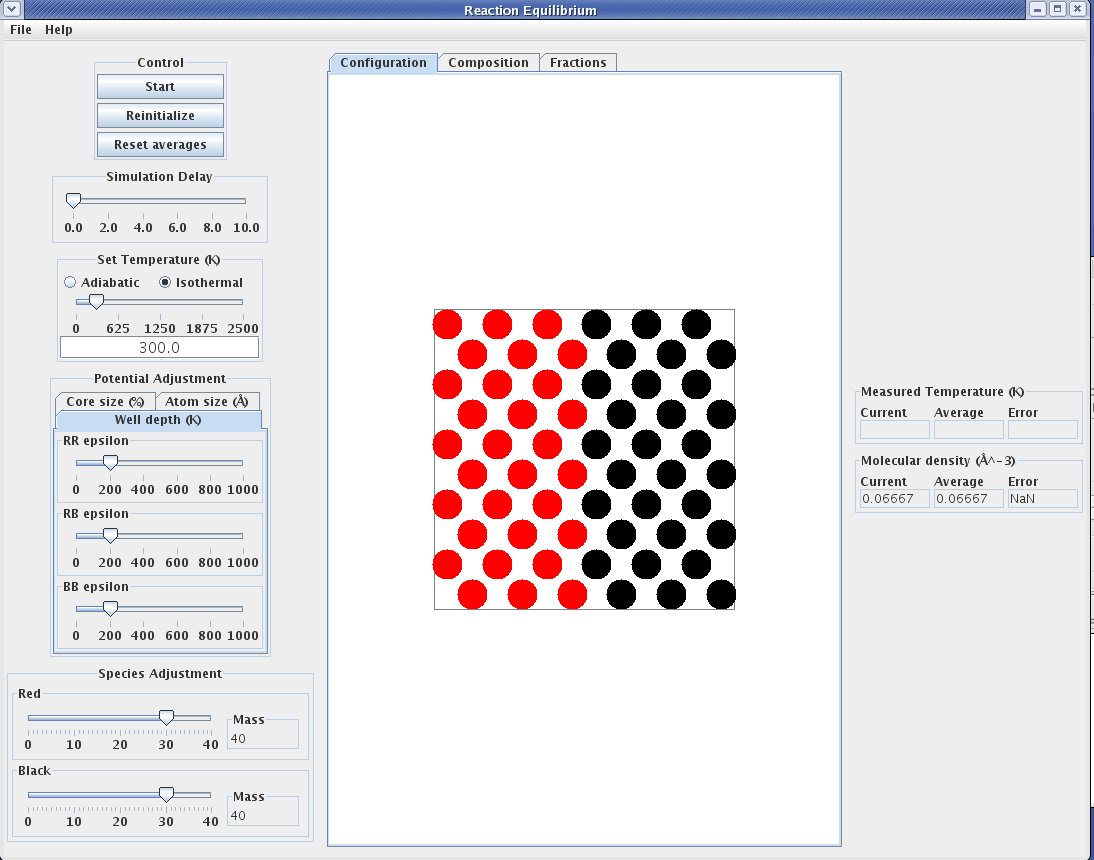
The left side of the display, referred to as the "Control Panel", contains controls that allow the user to interact with the simulation.
The first item on the "Control Panel" is the "Control Box", which contains buttons that :
- Start and stop the simulation (Start button)
- Restart the simulation from its initial state (Reinitialize button)
- Reset averages by discarding any previous contributions (Reset averages button)
- Expand the box to allow the formation of the vapor phase (Expand button)
The next item on the "Control Panel" is the delay slider, which introduces a delay in the propagation of the system. Increasing the delay has the effect of slowing down the motion so that it is easier observe what the molecules are doing. The delay should be set to zero when collecting data, so that the simulation proceeds as quickly as possible.
The next item on the "Control Panel" is the temperature control that permits setting the simulation as adiabatic or isothermal with the temperature selection radio buttons. If the temperature selection setting is isothermal, the temperature slider becomes available and allows the simulation temperature to be controlled.
The "Potential Adjustment tabs" present controls that permit changing atom interaction properties. These parameters are described in the [Model](ReactionEquilibrium/Background/Reaction Equilibrium Model) section of this documentation. The tabs are as follows
- Atom size adjusts, via the atom size slider, the σ value of both red and black atoms (they cannot be set to be different from each other).
- Core size adjusts, via the core size sliders, the κ value which specifies the size of the repulsive core relative to the attractive shell. This parameter can be set differentaly for the three atom interaction possibilities (red-red, black-black, red-black).
- Well depth adjust, via the well depth sliders, the ε value that describes the strength of attraction between each pair. This parameter can be set differentaly for the three atom interaction possibilities (red-red, black-black, red-black).
The "Species adjustment panel" presents sliders that permit you to independently set the number of red (red species slider) and black (black species slider) atoms in the system.
The middle section of the display is referred to as the "Grahpics Panel".
- The "Configuration tab" (shown above) contains a dynamic representation of the atom behavior.
- The "Composition tab" presents a strip-chart graph of the mole fractions of all five molecular species (red and black monomers, and red-red, red-black, and black-black dimers) for the recent history of the simulation.
- The "Data tab" provides a table of averages and confidence limits for the mole fractions of the five molecular species, taken from the the lesser of the beginning of the simulation or the last time the reset button was pressed.
On the far right is the "Data Display Panel"
The observed simulation temperature is displayed in the temperature meter display box. The temperature meter will not hold to a strictly fixed value, but instead will fluctuate about an average value, because small systems such as this exhibit relatively large fluctuations in their mechanical properties. It may take a while for the system to equilibrate to a set temperature, so before collecting data make sure that the temperature meter is fluctuating about the desired value.
The next item on the "Data Display Panel" is the molecular density meter.